Graph output for conan info command
Warning
This is a migrated feature. Please refer to conan graph info learn about the changes. Most of the functionality remains intact and the main changes are to the command line.
The conan info command can generate a visualization of the dependency graph, it comes in two flavors: html and dot (GraphViz), but both take the same template parameters. Conan will use the following input files, if found, inside the Conan cache folder:
HTML output: <cache>/templates/output/info_graph.html.
DOT output: <cache>/templates/output/info_graph.dot.
Context
These files should be valid Jinja2 documentation templates and they will be feed with the following context:
base_template_path: absolute path to the directory where the chosen template file is located. It is needed if your output file needs to link assets distributed together with the template file (see HTML example linking CSS and JS files).
graph: this object contains all the information from the graph of dependencies. It offers the following API:
graph.nodes: list ofNodeobjects with the information for each Conan package included in the graph (see below API for thisNodeobject).
graph.edges: list of tuples with all the connections in the dependency graph. First item in the tuple is the consumerNodeand second item the requiredNode.
graph.binary_color(node): function that retrieves the Conan default color based on thenode.binaryvalue.
The Node objects in the context provide all the required information about each package:
node.label: display name for the conanfile.
node.short_label:name/versionparts of the Conan reference.
node.package_id: the package identifier.
node.is_build_requires:
node.binary: it identifies where the binary comes from (cache, download, build,missing, update).
node.data(): returns a dictionary that contains data from the recipe, members areurl,homepage,license,authorandtopics.
Examples
These are two examples of templates that Conan is currently using for the basic functionality. You can refer to the Jinja2 documentation for more information about the logic and filters you can use in these templates.
Let us know if you have a cool template you want to share with the Conan community.
Dot files:
Default template for the DOT output contains just the node names and the edges:
digraph {
    {%- for src, dst in graph.edges %}
        "{{ src.label }}" -> "{{ dst.label }}"
    {%- endfor %}
}
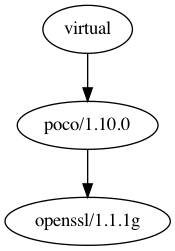
The output will compose a valid dot file:
conan info poco/1.10.0@ --graph=poco.dot
digraph {
        "poco/1.10.0" -> "openssl/1.1.1g"
        "virtual" -> "poco/1.10.0"
}
Use dot to render the default view of the generated graph:
dot -Tpng poco.dot > poco.png
HTML files:
HTML templates are more complicated than dot ones, but the HTML can provide a nicer
view of the graph and easily include JavaScript to create an interactive view of the graph.
In this example we assume you have distributed the following files to your cache folder:
<cache>/templates/output/css/vis.min.css
<cache>/templates/output/js/vis.min.js
<cache>/templates/output/info_graph.html
Our template will be the info_graph.html file, and it will use the assets from the local files provided in the cache (most use cases will use files from the internet using the full URL).
These are some snippets from the info_graph.html template, it uses the vis.js library:
<html lang="en">
    <head>
        {# ... #}
        <script type="text/javascript" src="{{ base_template_path }}/js/vis.min.js"></script>
        <link href="{{ base_template_path }}/css/vis.min.css" rel="stylesheet" type="text/css"/>
    </head>

    <body>
        {# ... #}

        <div style="width: 100%;">
            <div id="mynetwork"></div>
        </div>

        {# ... #}

        <script type="text/javascript">
            var nodes = new vis.DataSet([
                {%- for node in graph.nodes %}
                    {
                        id: {{ node.id }},
                        label: '{{ node.short_label }}',
                        shape: '{% if node.is_build_requires %}ellipse{% else %}box{% endif %}',
                        color: { background: '{{ graph.binary_color(node) }}'},
                        fulllabel: '<h3>{{ node.label }}</h3>' +
                                '<ul>' +
                                '    <li><b>id</b>: {{ node.package_id }}</li>' +
                                {%- for key, value in node.data().items() %}
                                {%- if value %}
                                '    <li><b>{{ key }}</b>: {{ value }}</li>' +
                                {%- endif %}
                                {%- endfor %}
                                '</ul>'
                    }{%- if not loop.last %},{% endif %}
                {%- endfor %}
            ]);
            var edges = new vis.DataSet([
                {%- for src, dst in graph.edges %}
                    { from: {{ src.id }}, to: {{ dst.id }} }{%- if not loop.last %},{% endif %}
                {%- endfor %}
            ]);

            var container = document.getElementById('mynetwork');
            var data = {
                nodes: nodes,
                edges: edges
            };
            var network = new vis.Network(container, data, options);
        </script>
    </body>
</html>